
Choosing the best 1528-1603 Nm Ase Source in 2026 starts with a practical question: where must its spectrum remain flat, and how much output power does the system need? This wavelength span covers the C-band and extends into the L-band. That makes gain flatness, usable bandwidth, output stability, and optical signal-to-noise ratio important selection criteria. A wide spectrum alone is not enough.
Standards provide useful context. ITU-T Recommendation G.694.1 defines the DWDM frequency grid, while G.652 describes transmission-fiber characteristics. Neither standard ranks ASE sources, so buyers should compare measured specifications rather than infer performance from a product label. LightCounting’s optical-component market reports offer broader context on optical-network demand, but market growth does not prove that one source is technically superior. Check the actual test conditions.
Professor Govind P. Agrawal’s published work on optical amplifiers highlights a relevant engineering principle: bandwidth and gain behavior must be assessed together. This is a paraphrase of his technical work, not a direct quotation. For a real comparison, request a calibrated spectrum, power readings across the operating band, and stability data over time. Look closely at the edges. A source may appear broad on a chart yet deliver uneven power where a test setup needs it most. The details matter. And they are easy to overlook.
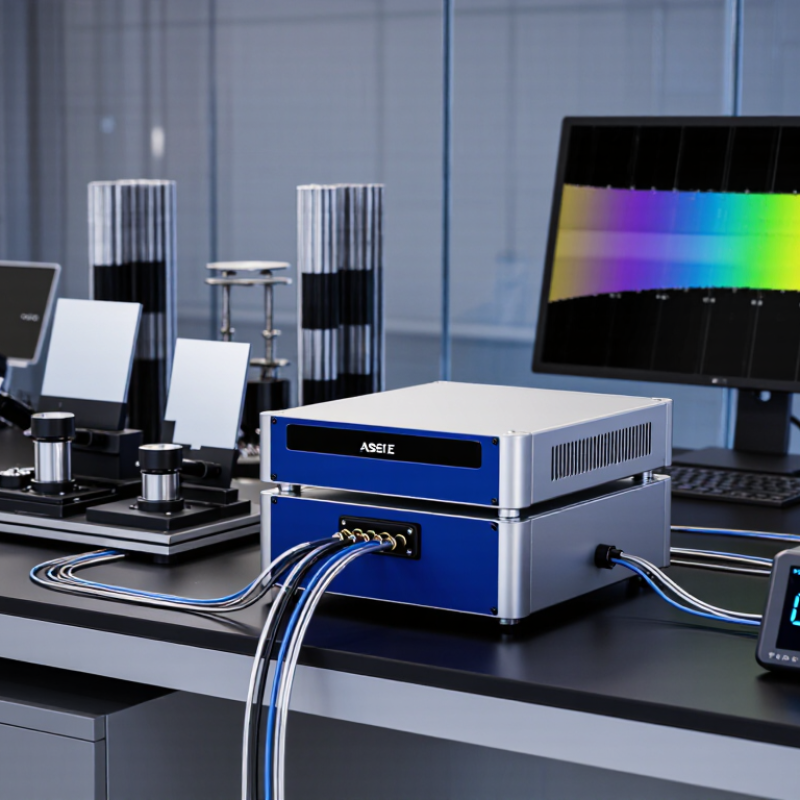
A 1528–1603 nm amplified spontaneous emission spectrum covers a broad region of the near-infrared. Its shorter wavelengths sit near the familiar telecommunications C-band, while the upper end reaches beyond the commonly used L-band range. That span can support component testing, sensing experiments, and optical system evaluation. But a wide stated range does not guarantee even output across every wavelength.
Check the spectrum’s shape, not just its endpoints. An optical spectrum analyzer can reveal dips, peaks, and uneven spectral power. Measure with suitable resolution, and note the instrument settings; otherwise, comparisons may mislead. Also review output stability and power requirements for your setup. A small ripple may matter more than expected in a sensitive measurement. It is easy to focus on headline bandwidth and overlook that detail.
Tips: Request a spectrum plot with clearly labeled axes and measurement conditions. Compare power across the wavelengths your application actually uses. Don’t assume a flat spectrum. Recheck after warm-up, since operating conditions can affect readings. A perfect-looking plot is not the whole story; real setups have connectors, losses, and measurement uncertainty.

A 1528–1603 nm ASE source should be judged by its usable spectrum, not its headline bandwidth. This window starts near the C-band and extends into the L-band, so check that output remains continuous across the full range. ITU-T G.694.1 anchors the DWDM frequency grid at 193.1 THz and defines spacings from 12.5 GHz upward. That grid is a useful reference when checking whether the source covers the channels a test setup needs.
Measure spectral flatness, total output power, stability, and polarization dependence under stated operating conditions. IEC 61290-1-1 describes optical spectrum analyzer methods for measuring optical amplifier power and gain; its measurement discipline is useful when comparing source specifications. Ask for raw spectral traces, not just a single flatness figure. A small ripple can matter when filters or amplifiers sit downstream. Small details matter.
Also check warm-up drift, connector repeatability, and power variation over time. These practical checks help reveal behavior that a one-time lab reading may miss. One trade-off is easy to overlook: more output power is not automatically better if it increases spectral ripple or shifts the operating point. I would compare measurements at the intended temperature and load, then repeat them. Real setups are imperfect. That is exactly why repeatability belongs in the specification review.
The best source is the one that delivers verified, application-suitable performance across the full requested band. The figures below are practical evaluation targets or test requirements—not specifications for a particular product or universal industry limits.
| Evaluation criterion | Useful data or suggested target | How to evaluate it | Why it matters |
|---|---|---|---|
| Wavelength coverage | 1528–1603 nm; 75 nm total span | Confirm usable output at both band edges and throughout the requested range using a calibrated optical spectrum analyzer (OSA). | The requested range extends beyond the commonly used C-band region. A source labeled “C-band” may not cover the upper end near 1603 nm. |
| Spectral flatness | A ≤3 dB peak-to-valley variation is a useful starting target, if the application needs a flat spectrum. | Measure the spectrum over the specified wavelength interval, with the measurement resolution and any smoothing clearly stated. | Large spectral variations can create unequal illumination or bias broadband component and system measurements. |
| Output power | Set the required total power from the system’s link budget and insertion losses; request both total power and power versus wavelength. | Measure with a calibrated power meter and OSA. Check whether the stated value is before or after any output connector or fiber patch cord. | Total power alone does not show how much power is available at each wavelength across a 75 nm band. |
| Spectral power density | Request data in mW/nm or dBm/nm, with the OSA resolution bandwidth or measurement method specified. | Compare spectra measured using the same resolution bandwidth, wavelength interval, and detector settings. | This supports a meaningful comparison between broadband sources and helps estimate available power within a narrower measurement band. |
| Short-term power stability | Define an application-specific limit; for initial screening, a change of no more than 0.2 dB over one hour is a practical test target. | Record output power at a fixed wavelength or across the band under stated warm-up, ambient-temperature, and measurement conditions. | Instability can reduce repeatability in laboratory measurements and system testing. |
| Polarization behavior | Specify whether low degree of polarization, a defined polarization state, or polarization-maintaining output is required. Do not assume one behavior from the ASE label. | Measure polarization behavior over the relevant wavelength range and verify the output fiber type and any polarization-control requirements. | Polarization sensitivity in the device under test can affect measurement results. |
| Spectral artifacts and unwanted lines | Ask for a full-band spectrum and the measured peak level of any narrow features relative to the broadband level. | Inspect the OSA trace for narrow peaks, dips, or edge roll-off; use adequate dynamic range and resolution. | Unexpected spectral features can interfere with testing that assumes a smooth broadband source. |
| Warm-up and operating conditions | Record the specified warm-up time, operating temperature range, and stabilization conditions; compare sources under matched conditions. | Repeat power and spectral measurements after warm-up and, where relevant, at the limits of the intended operating environment. | Performance can change with temperature and operating state, so test conditions should match actual use. |
| Fiber, connector, and interface | Confirm fiber type, connector style, output-port configuration, and compatibility with the measurement setup. | Check the datasheet and inspect connector cleanliness and end-face condition before connecting to sensitive equipment. | Interface mismatches and contaminated connectors can cause coupling loss or damage. |
| Documentation and verification | Request a dated spectrum, output-power measurement, test conditions, and stated measurement uncertainty where available. | Compare the delivered unit’s test data with the acceptance criteria over the full 1528–1603 nm range. | Traceable, condition-specific data is more useful than a headline bandwidth or nominal power figure alone. |
Practical selection rule: Prioritize demonstrated full-band coverage, application-appropriate spectral flatness, and stable power. Treat suggested numeric targets as screening criteria and adjust them to the measurement uncertainty and requirements of the intended application.
For a 1528–1603 nm ASE source, “best” depends on the job. A component test bench may need a smooth spectrum, while an amplifier experiment may prioritize output power and stability. Check usable power across the full 75 nm range, not only the headline total. A bright center can hide weak spectral edges.
Design choices shape those trade-offs. Erbium-doped fiber ASE designs can provide broad output, while gain-flattening filters can reduce spectral peaks and dips. Longer fiber or stronger pumping may raise power, but can also affect flatness and thermal stability. ITU-T G.694.1 defines a 100 GHz DWDM grid, equivalent to roughly 0.8 nm near 1550 nm; that makes spectral resolution relevant when testing channel components. Small details matter.
For transmission-related testing, fiber loss also frames the source requirement. ITU-T G.652 specifies a maximum attenuation of 0.30 dB/km at 1550 nm for compliant single-mode fiber. That figure is not a measure of ASE-source quality, but it helps explain why power and spectral shape around this region matter. Ask for measured spectrum, ripple, output stability, and polarization behavior under stated operating conditions. One caveat: published specifications do not always show edge performance clearly. I would verify it on the actual setup.
There is no single best design for every application. For coverage across the full 1528–1603 nm window, a broadband C+L-band erbium ASE design is the most direct fit; a C-band or L-band design may suit applications that need only one portion of the spectrum.
Nominal wavelength windows are shown for design comparison, not as measured spectra. Actual bandwidth and spectral power density depend on the gain medium, pump configuration, filtering, and operating conditions. The C/L boundary is approximate.
What Is the Best 1528 to 1603 nm ASE Source in 2026?
Comparing Source Options for 2026 Applications
Choosing a source for the 1528–1603 nm band depends on the measurement, not the calendar year. A broadband ASE source can illuminate a wide wavelength range without sweeping, making it useful for component testing and optical sensing. A tunable source offers finer wavelength control, but measurements may take longer. A superluminescent diode can suit narrower bandwidth needs, though its coverage may not span the full band. There is no universal winner.
Compare usable bandwidth, spectral flatness, output power, and stability under your actual operating conditions. A spectrum that looks smooth on a specification sheet may reveal dips when measured through your setup. Check polarization behavior, connector compatibility, and how output changes as the unit warms. For repeatable results, record the instrument settings and use a calibrated power meter or optical spectrum analyzer. Small details matter.
Tips: Test with your own cables and filters. Leave warm-up time. Recheck after integration. If the source will serve several applications, weigh broad coverage against the extra control a tunable unit provides. I would not choose by headline power alone; that shortcut can be misleading.
Selecting an ASE source across 1528–1603 nm starts with the actual measurement task, not the widest specification sheet. This span covers wavelengths used across the C- and L-band regions, but a broad range alone does not guarantee useful output. Start by matching the source’s spectral density and total power to the instrument under test. Useful detail. Check wavelength coverage at the operating temperature, not just at a nominal room condition.
Ask for a spectrum showing output across the full band, including edge roll-off and ripple. Then check power stability, polarization behavior, and connector type against your setup. A small mismatch can distort a measurement. For verification, connect a calibrated optical spectrum analyzer and record its resolution bandwidth, input settings, and warm-up time. Watch for detector saturation, which can make a spectrum look flatter than it is. Repeat the scan after reconnecting the fiber; connector handling can change readings more than expected.
Compare the measured trace with the supplier’s stated limits, using the same measurement conditions where possible. If the source will run for long periods, log output power and spectral shape over several hours. I would still question a single clean trace: it says little about repeatability. Keep the test setup simple, document any adapters, and note uncertainty rather than hiding it. The best-fit source is the one that meets your application’s needs under conditions you can reproduce.
© 2023 JEM Electronics, Inc. – United States Cable Assembly. All rights reserved.