How to Choose Optical Inspection Tools for Your Business?
Choosing Optical Inspection Tools is less about buying the most advanced camera and more about finding defects your process actually produces. A scratched coating, a misplaced label, and a hairline crack demand different lighting, resolution, and inspection speeds. The right setup must fit the product, production line, and people who will use it.
Quality-management expert W. Edwards Deming said, “In God we trust; all others must bring data.” His principle applies here: compare sample images, defect-detection results, and false-reject rates before committing. A polished demo is not enough. Test the tool on real parts, including awkward cases such as glare on a curved surface or a tiny mark near an edge. Small details matter.
This guide explains how to assess image quality, illumination, software, integration, and service support. It also considers practical limits: a system that detects every flaw may slow production or reject sound products. That trade-off is easy to overlook.
Ask vendors to run a trial using your own samples. Record what the system misses, not only what it catches. Then compare total operating costs, training needs, and maintenance—not just the purchase price. One more question: who reviews borderline images when the line is busy? A careful choice can improve consistency, but no tool replaces clear inspection criteria and regular checks. Teams sometimes discover that only after installation. That is worth reflecting on before you buy.
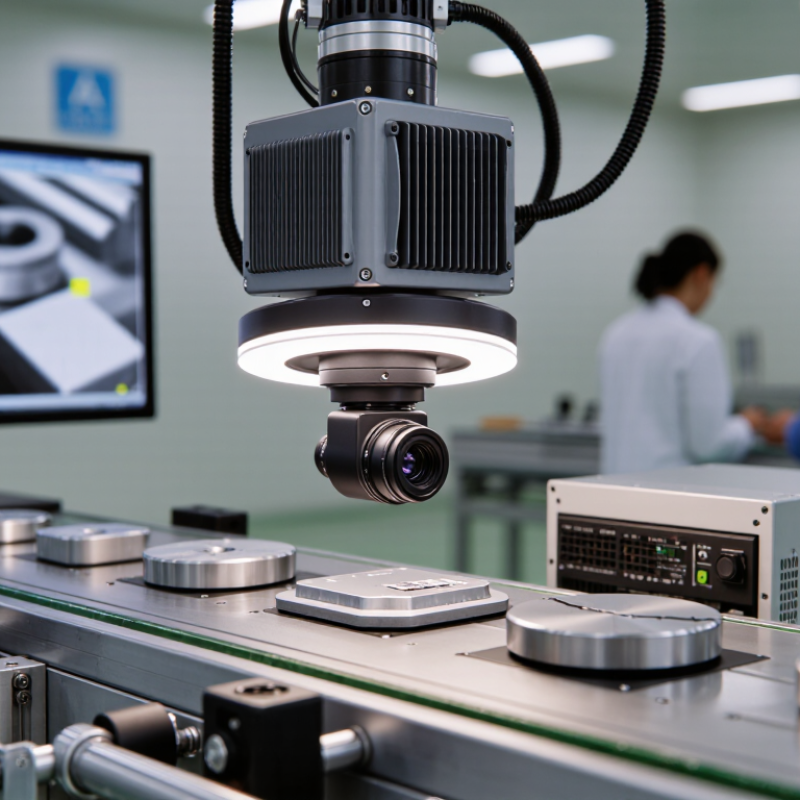
Define Surface-Texture Needs with ISO 25178 Parameters Sa, Sq, and Sz
Choosing an optical inspection tool starts with the surface features your business must control. ISO 25178 offers useful parameters, but no single value tells the whole story. Sa is the arithmetic mean of surface heights. It gives a clear average, yet can hide a small scratch on an otherwise smooth part. Sq is the root mean square height. Because larger deviations influence it more, Sq can help flag surfaces with scattered pits or raised areas. Sz measures the height between the highest peak and deepest valley, making isolated defects easier to notice.
Tips: Compare Sa, Sq, and Sz on the same measured area. Keep filtering, resolution, and evaluation settings consistent. A shiny coating may need different optical settings from a matte machined face. Record those choices, or later comparisons may mislead.
Match the tool’s measurement range and field of view to the actual part. A wide field can reveal texture variation across a molded panel, while a smaller region may suit a precision seal. Check repeatability on representative samples, not only a clean reference piece. Sq and Sz can shift when a scan captures one unusual peak, so inspect the surface map as well as the reported numbers. It is easy to overvalue a tidy figure; I would treat it as one clue, not the decision itself.
How to Choose Optical Inspection Tools for Your Business? — Define Surface-Texture Needs with ISO 25178 Parameters Sa, Sq, and Sz | Example Surface | Illustrative Sa (µm) | Illustrative Sq (µm) | Illustrative Sz (µm) | What the Parameters Indicate | Optical Inspection Considerations |
| Polished metal surface | 0.05 | 0.07 | 0.45 | Low average height variation; occasional peaks or pits can make Sz noticeably larger than Sa. | Consider an optical method with suitable vertical resolution and sufficient signal on reflective surfaces. Check for missing data or interference artefacts. |
| Ground metal surface | 0.80 | 1.00 | 6.50 | Moderate texture; Sq gives greater weight to larger height deviations than Sa. | Confirm that the instrument captures the expected lateral spacing and height range across representative measurement areas. |
| Machined surface with visible tool marks | 2.50 | 3.20 | 22.00 | Directional marks and isolated features may affect the measured values; results depend on the evaluated area and processing. | Choose a field of view and lateral sampling interval that resolve the marks. Measure multiple locations if texture varies across the part. |
| Blasted surface | 8.00 | 10.00 | 75.00 | Pronounced texture and larger height excursions; Sz is particularly influenced by the highest peak and deepest pit in the evaluation area. | Check the instrument’s vertical measurement range, ability to capture steep slopes, and coverage of a sufficiently representative area. |
| Parameter definitions: Sa is the arithmetic mean of the absolute surface height over the evaluated area. Sq is the root mean square of surface height over that area. Sz is the maximum height, calculated as the maximum peak height plus the maximum pit depth within the evaluated area. |
Selection note: The example values are illustrative, not acceptance limits or guaranteed values for these surface types. Actual results depend on the part, measurement area, instrument, and data-processing settings. Compare candidate tools using the required lateral and vertical resolution, surface reflectivity, slope capability, field of view, repeatability, and relevant ISO 25178 measurement settings.
Match Optical Methods to Feature Size, Field of View, and Resolution
Choosing an optical inspection tool starts with the smallest feature that must be judged reliably. A 20-micrometre scratch and a 2-micrometre pore need different optics, even on the same part. Under the Rayleigh criterion, 550-nanometre light and a 0.5 numerical-aperture objective give a theoretical lateral resolution near 0.67 micrometres. Real systems perform less ideally. Sensor pixels, focus, vibration, and surface contrast all matter.
Field of view creates a practical trade-off. A wide view can inspect an entire connector face quickly, but may leave too few pixels across a pin edge. As a working rule, sample the smallest feature with at least two pixels; three or four provide more dependable measurements. Check the object-space pixel size, not just the camera’s megapixel count. The EMVA 1288 standard describes sensor measurements such as quantum efficiency and temporal dark noise, useful when comparing cameras in dim or high-speed setups.
For height and surface texture, compare measurement methods as well as magnification. ISO 25178-600:2019 identifies metrological characteristics for areal topography instruments, including lateral resolution and topography fidelity. A sharper-looking image is not automatically a better measurement. Test representative parts, including dull, reflective, and slightly misaligned samples. This step can be inconvenient. Skipping it can be worse. A small trial often reveals that the chosen field of view is either too narrow for throughput or too wide for the defect of interest.
Compare 3D System Accuracy Using VDI/VDE 2634 Test Criteria
Choosing an optical inspection tool is easier when its accuracy claims come from repeatable tests. VDI/VDE 2634 provides test methods for optical 3D measuring systems, but the relevant part depends on system design. Area-scanning systems are commonly assessed for probing form error, probing size error, and sphere-spacing error under Part 2. Multi-view systems may require different checks, including length and flatness performance under Part 3. Confirm the standard edition, test configuration, and reported maximum permissible errors. A certificate without these details is hard to compare.
Ask for results from calibrated reference artefacts, such as certified spheres or a flatness standard, measured across the working volume. Compare errors at the center and near the edges, where camera angles and surface access can affect results. Keep test distance, lighting, temperature, and mounting conditions close to your production setup. Small changes matter. Then scan a representative part: a machined bracket with deep holes may behave differently from a smooth sphere. Review repeatability as well as stated accuracy, and check whether measurement uncertainty is included. Test reports can still leave questions; request detailed results and repeat checks after installation. This takes time, but it can prevent a confident-looking measurement from driving a poor inspection decision.
Check Optical Sensor Performance Against ISO 10360-8
Choosing optical inspection tools starts with the task: measuring a small machined edge is different from scanning a broad, reflective surface. ISO 10360-8:2013 sets acceptance and reverification tests for coordinate measuring machines fitted with optical distance sensors. Ask suppliers for measured probing and length errors, not just a headline accuracy figure. Check the test length, sensor setup, surface finish, and operating distance. Those details matter. A result gathered on a matte reference sphere may not predict performance on a shiny production part.
Compare the reported errors with your tolerance limits and inspection frequency. Request a traceable calibration report, including uncertainty and the conditions used. NIST Technical Note 1297 explains that a coverage factor of k=2 often corresponds to roughly 95% coverage, when its assumptions apply; uncertainty should therefore be read alongside the measured error. A 10-micrometre error may be acceptable for one task and costly for another. Test representative parts, including awkward edges and curved surfaces. That sounds straightforward. It isn’t always: dust, vibration, and operator alignment can shift results. Record these influences during a trial, then decide whether the tool remains stable across a normal work shift.
Evaluate Throughput, Calibration Needs, and Total Cost of Ownership
Choosing optical inspection tools starts with the work they must handle each shift. Compare required units per hour with the system’s verified rate, including image capture, analysis, and reject handling. A fast camera is not enough if software queues images or operators must pause the line. Speed is not capacity. Test representative parts, including scratched, reflective, and slightly misaligned samples, at realistic line speeds.
Calibration needs depend on measurement precision, operating conditions, and staff capability. Ask how the tool detects drift, who can make adjustments, and whether calibration records are easy to retrieve. Dust, vibration, and temperature changes may affect readings, even in a controlled workspace. Keep a known-good reference part nearby and check it on a defined schedule. The schedule may need revision after actual production use.
Total cost of ownership includes more than the purchase price. Add installation, fixtures, software updates, training, service, spare lighting, and planned downtime to a multi-year estimate. Then compare cost per inspected unit, not just the quote. A tidy spreadsheet can still miss the cost of interrupted production. Leave room for unexpected maintenance, and check whether the tool fits existing workflows before committing.