
Global buyers are entering 2026 with stricter energy, hygiene, and reliability expectations. An oil free compressor is no longer limited to pharmaceutical plants. It now supports food processing, electronics, medical air, textiles, and clean manufacturing. These sectors cannot tolerate lubricant carryover near products, sensors, or sterile equipment.
The International Energy Agency notes that compressed air can represent around 10% of industrial electricity use. The U.S. Department of Energy also warns that leakage, pressure losses, and poor controls can waste significant energy. Small faults become expensive.
This guide examines leading oil free compressor manufacturers serving international markets in 2026. It considers compressor technology, ISO 8573-1 air quality claims, efficiency data, service coverage, spare-parts access, and lifecycle costs. ISO 8573-1 provides the framework for classifying particles, water, and oil in compressed air. Buyers should still verify test conditions. Marketing language can sound cleaner than factory reality.
Industry forecasts from MarketsandMarkets and Grand View Research indicate continued growth in the global air compressor market. However, market-size estimates vary because researchers define “oil free” differently. That difference matters. A laboratory air system may require a different design from a dusty automotive workshop.
The strongest manufacturers usually provide audited performance data, installation guidance, remote monitoring, and regional technicians. Some suppliers look impressive on paper. Field performance may tell another story. Energy tariffs, ambient temperature, duty cycle, and maintenance quality can change the final ranking.
This 2026 overview is designed for practical comparison, not blind purchasing. It highlights established brands, emerging competitors, and the questions global buyers should ask before signing a specification. Reliable air is valuable. Predictable ownership costs matter more.
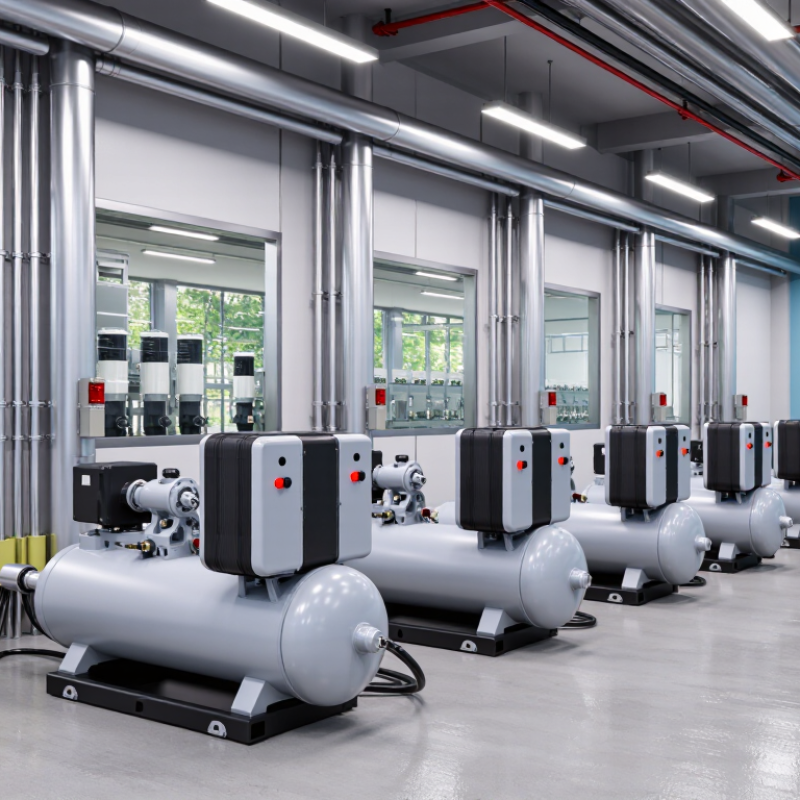
Oil-free compressors protect sensitive processes from lubricant carryover, but “oil-free” does not mean contamination-free. ISO 8573-1 Class 0 requires the supplier to specify the strictest oil concentration class, with testing under defined conditions. Buyers should also check intake air, piping, seals, and receiver hygiene. Contamination can enter after the compressor.
Selection should begin with measured demand, not the largest nameplate. Compare free air delivery, working pressure, duty cycle, and performance during partial load. The U.S. Department of Energy’s Compressed Air Sourcebook notes that compressed air can consume about 10% of industrial electricity. Therefore, control strategy matters. Variable-speed operation may help fluctuating demand, while poor sequencing can increase energy use. Small leaks still matter.
Air quality needs a practical specification. ISO 8573-1 defines particle, water, and oil classes, including pressure dew point requirements. Food, pharmaceutical, electronics, and laboratory users often need tighter control than general workshops. Check the compressor’s performance at the actual site temperature, altitude, and voltage. Ask for ISO 1217 test data, service intervals, noise levels, and lifecycle energy figures. A useful warning: advertised efficiency may reflect ideal conditions. I would request a logged demand profile before purchase, even if it delays the quotation. That extra step can expose oversized equipment, low-load losses, or unrealistic pressure assumptions.
Evaluating oil-free compressor manufacturers in 2026 requires more than checking catalogue pressure and flow. The U.S. Department of Energy reports that compressed-air systems can consume about 10% of industrial electricity. It also notes that leaks may waste 20–30% of compressor output. A supplier should therefore provide measured specific power, leak-control guidance, and performance data at your actual operating pressure.
Ask for independent testing against ISO 1217, not only factory brochures. Confirm whether “oil-free” applies to the compression chamber, cooling circuit, and delivered air. ISO 8573-1 defines air-quality classes, so request laboratory results for oil aerosol, particles, and humidity. A credible manufacturer will explain test conditions clearly. Vague numbers deserve caution.
Site experience matters. Reviewers should compare performance at 25%, 50%, and full load, especially where demand changes hourly. Check service intervals, replacement-part availability, noise levels, heat recovery, and controls compatibility. The International Energy Agency’s energy-efficiency research repeatedly identifies system design and operational control as major saving opportunities, not compressor efficiency alone.
I would also request three years of operating data from similar plants. Yet references can be selective. Visit one site if possible, and inspect drain lines, filters, and maintenance records. A lower purchase price may hide higher electricity use. The uncomfortable question is simple: can the supplier prove lifetime performance under your conditions, or only promise it?
A manufacturer-neutral evaluation framework based on performance, compliance, lifecycle cost, service capability, and application fit.
| Evaluation Dimension | What Global Buyers Should Compare | Relevant Technical Data or Standard | Evidence to Request from the Manufacturer | Why It Matters in 2026 | Suggested Weight |
|---|---|---|---|---|---|
| Oil-Free Air Quality | Whether the compressor produces air without intentional oil added to the compression chamber and whether the complete system maintains the required air purity. | ISO 8573-1 Oil concentration should be verified against the required purity class, especially for Class 0 applications. | Independent test report, certification scope, sampling method, operating conditions, and a clearly stated oil-concentration limit. | Food, pharmaceutical, electronics, medical, and textile processes can be damaged or contaminated by oil aerosols or vapors. | 20% |
| Rated Flow and Pressure | Actual delivered air capacity at the buyer’s required discharge pressure, rather than nominal motor size or free-air displacement alone. | ISO 1217 Compare declared FAD, inlet conditions, discharge pressure, and tolerance using the same test basis. | Performance test curve, guaranteed FAD, pressure range, turndown data, and test conditions. | Incorrect comparison can cause undersizing, unstable plant pressure, or unnecessary energy consumption. | 15% |
| Energy Efficiency | Specific power across the expected load profile, including full-load, part-load, unloaded, standby, cooling, and auxiliary consumption. | Specific power is normally expressed as kW per m³/min or kW per 100 cfm. Evaluate against the complete operating profile rather than peak efficiency only. | Measured specific-power data, part-load curves, control logic, motor efficiency class, and annual energy model. | Electricity is commonly the largest operating cost over the compressor’s service life. | 20% |
| Compressor Technology Fit | Suitability of oil-free scroll, oil-free screw, centrifugal, or reciprocating technology for the required flow, pressure, duty cycle, and air-quality risk. | Scroll systems are commonly suited to smaller modular flows; screw systems to variable industrial demand; centrifugal systems to high, relatively stable flow; reciprocating systems to specialized pressure duties. | Technology selection rationale, operating envelope, minimum stable flow, maximum starts per hour, and application references without relying only on marketing claims. | Technology mismatch can reduce efficiency, increase maintenance, or create unstable operation. | 10% |
| Reliability and Duty Cycle | Continuous-duty suitability, operating hours, redundancy options, allowable ambient temperature, altitude, and cooling requirements. | Review design duty, rated service conditions, restart limitations, vibration limits, and expected availability. Do not treat a warranty period as a reliability rating. | Reliability data, failure-rate information where available, maintenance history, operating envelope, and reference installations with comparable duty. | Production interruptions can cost considerably more than the initial equipment price. | 10% |
| Lifecycle Cost | Purchase price plus installation, electricity, consumables, planned maintenance, unplanned repairs, r |
